Node overview
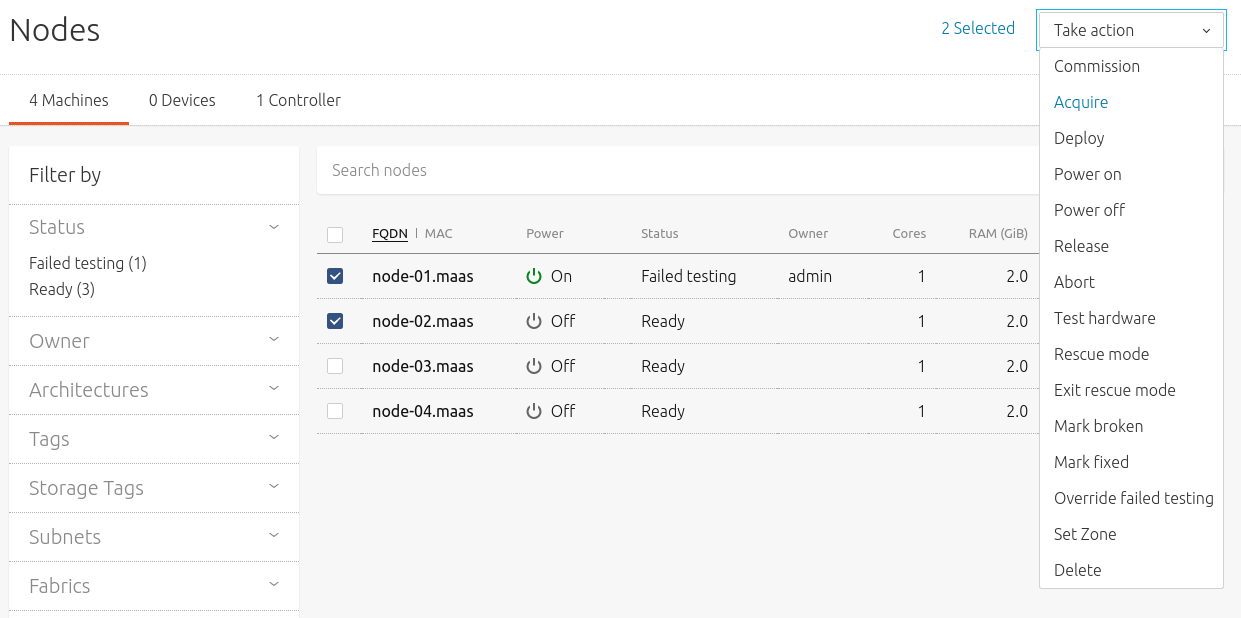
Select 'Nodes' from the top menu of the MAAS web UI to display a table listing all the nodes MAAS currently knows about.

The columns list the following details for each node:
- FQDN | MAC: The fully qualified domain name or the MAC address of the node.
- Power: 'On', 'Off' or 'Error' to highlight an error state.
- Status: The current status of the node, such as 'Ready', 'Commissioning' or 'Failed testing'.
- Owner: The MAAS account responsible for the node.
- Cores: The number of CPU cores detected on the node.
- RAM: The amount of RAM, in GiB, detected on the node.
Values within the table update to reflect the changing state of each node, such as during commissioning or deployment. These values are augmented by green, amber and red icons to represent successful, in-progress and failed transitions. The same icons and colours are used throughout the web UI to reflect a node's status.
Status icons can often be rolled-over with the cursor to reveal more details. For example, a failed hardware test script will place a warning icon alongside the hardware type tested by the script. Rolling the cursor over this will reveal which test failed.
The 'Add hardware' drop-down menu is used to add either new machines or a new chassis. This menu changes context when one or more nodes are selected from the table, using either the individual checkboxes in the first column or the column title checkbox to select all.
With one or mode nodes selected, the 'Add hardware' drop-down menu is renamed 'Take action' and provides access to the various node actions that can be applied to the selected node(s):

Note: The 'Filter by' section limits the nodes listed in the table to selected keywords and node attributes.
Node details
Click a node's FQDN or MAC address to open a detailed view of a node's status and configuration.

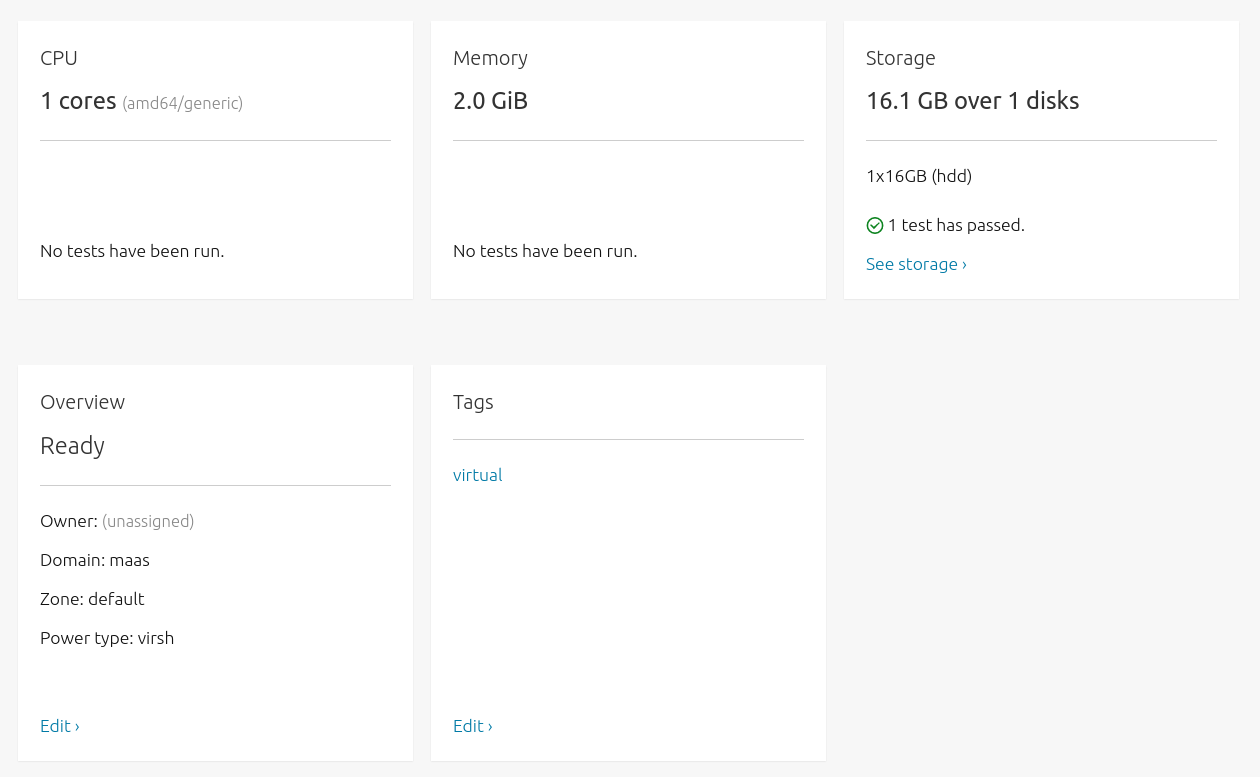
The default view is 'Machine summary', presented as a series of cards detailing the CPU, memory, storage and tag characteristics of the node, as well as an overview of its current status.
When relevant, 'Edit' links take you directly to the settings pane for the configuration referenced within the card.
The node menu bar within the web UI includes links to log output and configuration options:

The menu includes links to the following:
- Machine summary: Overview of CPU, memory, storage, tag and general settings.
- Interfaces: Network and interface configuration for a node.
- Storage: File system, partitioning and storage overview.
- Commissioning: Timestamped completion and status log from the commissioning process.
- Logs: Raw log output, switchable between YAML and XML output.
- Events: Timestamped status updates for events and actions performed on the node.
- Configuration: Machine and power configuration options.
